13.6.10
GEOTAGGED IMAGES BECOME ART
DATA VISUALISATION - I'm currently slightly obsessed with infographics and data visualisations. If you haven't got InformationIsBeautiful.net bookmarked or on your RSS reader, you should!
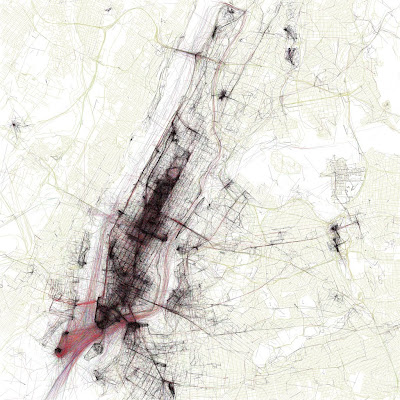
The maps above of New York and London created by Eric Fischer show where photographs have been taken. Location data comes from the public Flickr and Picasa search APIs.
As you can see the more photographs that are taken in a specific location the higher the concentration of lines. The images start to depict an interesting narrative as to where is popular and were isn't. It would be great to see this map in real-time, you would begin to see physical parts of your city 'trending'.
To see all 100 maps click here.
joes[a]fiend
Subscribe to:
Post Comments (Atom)
![joes[a]fiend](https://blogger.googleusercontent.com/img/b/R29vZ2xl/AVvXsEg222cf5GxVrJkhyTfEPVaoiNWus3LoNI2ubq7mrU1v-BBKmNS4KlUbvXCoiIMyAZHF8gAwByPn4ZDe7GKWj1WUDPaRoFdVYO7y9XpOaw-h5eOOONAUnNtktFtFGcZZjJ1wJlkFXqGeScSS/s1600-r/joesafiend_blog_banner.jpg)


![JOES[A]FIEND QR CODE](https://blogger.googleusercontent.com/img/b/R29vZ2xl/AVvXsEj3KiqyplNDzSE6uADwziK9hmQngCc58B2ozYZ2cdOuYFtitGOcFrlginoJBaVk6ZYh3ADfmTaNrhuE7_LuSZsPhdc5Nbv7bwO5u3CFGDShhH1igYvUJKUDZJD3bssUw6kq9fkBm6ZfiQ-H/s220/www.joesafiend.co.uk.png)
No comments:
Post a Comment